


Critical evaluation: Validity and chance
In critically evaluating a paper you also need to ask whether the results of a trial are valid or occurred by chance. Statistical tests are used to assess this. The most commonly encountered terms are p-values and confidence intervals.A p-value is the probability that a difference will be seen between two interventions in a trial when, in fact, there is no actual difference between the two interventions. In other words, it’s an indication of whether the result occurred by chance. Probability is measured on a scale of 0 to 1 where an impossible event is given 0 and an event that is certain to happen is given 1. In drug trials, by convention, p<0.05 is regarded as being statistically significant. It means that there is a less than 1 in 20 chance that you have observed a difference between your study drug and placebo when there is no actual difference between them.
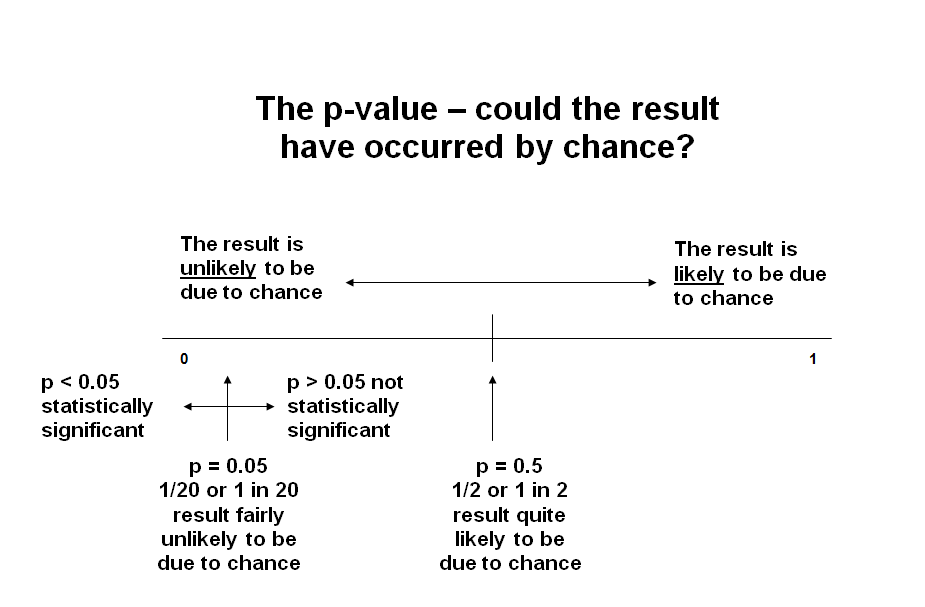 |
| Adapted from original courtesy of The Critical Appraisal Skills Programme (CASP) www.casp-uk.net |
When evaluating trial data, it’s important not to rely solely on p-values, but to consider whether the results are important. For instance, a trial might show that an antihypertensive drug improved blood pressure readings by 2mmHg per year, but would this be clinically important, even if it was statistically significant?
P-values are easily misinterpreted, and can be overtrusted and misused. The threshold of 0.05 to claim statistical significance is questionable, and many experts would advocate use of a lower threshold, e.g. 0.005. It’s also important to realise that p-values depend on the sample size and don’t consider the size of an effect or its clinical relevance. So the effect may be small and clinically unimportant, but the p-value can still be "significant" if the sample size is large. On the other hand, an effect can be large, but fail to meet the p<0.05 criterion if the sample size is small.
We also need to consider that p-values are based only on data from a sample of people, and the results you get for that sample may not be the results you would get with a different sample.
Because of these limitations we should look at other statistical values.
Confidence intervals can give us a measure of the certainty of a result. A clinical trial only tests a drug on a small group of people. The confidence interval tells us how likely it is that the results from that small group would still hold true for the entire population. They are expressed as a range of possible results, within which we expect the actual result to lie. A narrower confidence interval means the result is more precise and reliable, while a wider interval suggests less certainty.
Confidence intervals can give us a measure of the certainty of a result. A clinical trial only tests a drug on a small group of people. The confidence interval tells us how likely it is that the results from that small group would still hold true for the entire population. They are expressed as a range of possible results, within which we expect the actual result to lie. A narrower confidence interval means the result is more precise and reliable, while a wider interval suggests less certainty.
By convention, 95% confidence
intervals (95% CI) are normally used in drug trials, but you may also encounter 90 or 99%. A 95% CI means that you can be 95% sure that the true result lies within
the range quoted, or, expressed another way, that there is a 1 in 20 (i.e. 5%) chance that the
true value lies outside the range quoted. For example, if a study finds a drug lowers blood pressure by 10mmHg points with a 95% CI of 8 to 12, it means you can eb 95% confident that the true effects on the whole population is somewhere between an 8- and 12-point reduction.
Confidence intervals also show if the difference between interventions is statistically significant or not. When dealing with results which are expressed as ratios (e.g. relative risk, hazard ratio, odds ratio), if the confidence intervals do not contain 1.0 then the result is statistically significant. For example, consider the following results of 2 studies comparing Drug A and Drug B in reducing the risk of stroke. In the first study, the odds ratio is reported as 1.25% (95% CI 1.05 to 1.45) in favour of Drug B.

In the second study the odds ratio is reported as 1.10 (95% CI 0.90 to 1.30).

If you have a result not expressed as a ratio, such as an absolute difference in blood pressure, then if the confidence intervals do not contain zero the result is statistically significant. For example, consider the following results of 2 studies investigating Drug A versus Drug B for hypertension. In study 1 Drug A produced a mean drop in blood pressure of 5 mmHg (95% CI +1 to +7 mmHg) more than Drug B.

In study 2 of Drug A versus Drug B, Drug A caused a mean drop in blood pressure of 1 mmHg (95% CI -2 mmHg to +4 mmHg) compared to Drug B.

PAGE 3 OF 8. NEXT PAGE ›